%201.svg)

Quantifying the Relationship Between University Ranking Drop and Student Enrolment Decline


University rankings wield enormous influence over student decision‑making and institutional financial health.
A NORC methodological review notes that changes in rank are correlated with changes in both the quantity and quality of an institution’s applicant pool. In other words, falling in widely‑followed rankings can quickly translate into fewer applicants and weaker student profiles.
Given the stakes, universities need to understand how ranking shifts translate into enrolment outcomes and what they can do to mitigate the impact.
Why Rankings Influence Student Decisions
Applicants react to rank changes
A National Bureau of Economic Research study examining selective private institutions found that a less favourable U.S. News & World Report (USNWR) ranking reduces a school’s yield (the percentage of admitted students who enrol). The study estimated that it takes an improvement of six places to raise yield by one percentage point. When ranks decline, colleges must admit more students to maintain enrolment, often diminishing the quality of the incoming class.
The same study observed that a 10‑place drop in USNWR rank forces institutions to increase financial aid: a 10‑place drop leads to roughly a 4% reduction in “aid‑adjusted” tuition. Since published tuition rarely changes (institutions fear that lower sticker prices signal lower quality), colleges discount tuition via grants and scholarships to attract students.
Also, when Cornell University jumped eight places in the USNWR rankings (from 14th to 6th), researchers predicted a 3‑percentage‑point decline in the admit rate and a 1‑percentage‑point increase in yield. A senior administrator reported that the actual reduction in the admit rate and increase in yield and SAT scores were at least as large as predicted - a vivid example of rankings translating into admissions outcome.
Evidence of Enrolment Declines Following Ranking Drops
International student recruitment
International students often use global rankings to assess institutional quality and return on investment.
QS Insight data reveal that U.S. institutions in the top 100 of the QS World University Rankings increased their international‑student full‑time equivalent (FTE) count by 30% between 2021 and 2024; institutions ranked 100–500 grew only 12%. QS notes that lower-ranked institutions struggle to attract international students, and that a drop in ranking can have “a deleterious effect on international student recruitment”.
Northeastern University’s ascent
Northeastern University provides a positive example of the relationship between rankings and applicant interest. As the university climbed steadily in the USNWR rankings - breaking into the top 50 in 2016 - applications and yield rates surged.
Since fall 2020, the number of applicants increased by 52.6 % and the yield rate doubled from 23.7% to 50.3 %. Looking further back, Northeastern’s acceptance rate dropped from 37.9 % in 2010 to 5.2 % in 2024, and applications have grown over 550 % since 2001.
These figures show how sustained improvements in ranking can transform applicant behaviour.
Out‑of‑state tuition sensitivity
Public universities depend heavily on out‑of‑state tuition. According to EducationData, average public four‑year out‑of‑state tuition is $28,297 versus $9,750 for in‑state students. When rankings slip, out‑of‑state applicants - who have no geographic loyalty - are more likely to redirect their applications elsewhere.
The Princeton Review finding that application declines were concentrated among out‑of‑state students suggests that even modest ranking declines can erode a lucrative revenue stream.
Employability Rankings and Their Impact on Enrolment
The QS Graduate Employability Rankings assess how well institutions prepare students for the workforce. The 2019 methodology weights five indicators:
How employability rankings affect overall rank
Employability indicators often feed into broader ranking systems. Universities that drop on employability metrics see their overall rank fall and their appeal to career‑oriented applicants diminish.
For instance, the NBER study showed that a less favourable ranking compels institutions to offer more financial aid. Because the QS employability ranking assigns 65% of its weight to employer reputation, alumni outcomes and partnerships, a significant slide in these factors can quickly cascade into lower overall rankings.
Real‑world employability outcomes
Employability success stories demonstrate the potential upside of focusing on graduate outcomes:
- Arizona State University (ASU) reports that 89% of its graduates were employed or had job offers within 90 days of graduation. External sources cite an 83% job‑placement rate and note that ASU ranks #2 among U.S. public universities for employability. Strong career services and employer partnerships likely contributed to ASU’s improved QS ranking and rising applications.
- Northeastern University built an extensive co‑op program and invested in career services, which coincided with its ranking climb and surge in applications. Employer reputation and alumni success are baked into QS employability metrics, meaning that such programs directly support ranking improvements.
Financial Impact of Ranking Drops
Ranking declines translate into lost tuition revenue. The magnitude depends on the institution’s size, tuition mix (composition of tuition revenue across different student groups or programs) and sensitivity of applicants to rankings.
Private university scenario
Consider a private university with 10,000 students and average tuition of $38,421 per year (the typical tuition for private nonprofits). Suppose its ranking falls by five places in a prominent ranking list, resulting in a 3 % drop in applications (300 fewer applicants). If the university maintains its admit rate, this drop translates into roughly 200 fewer enrolled students (assuming a two‑thirds yield). Lost tuition revenue is substantial:
- Annual loss: 200 students × $38,421 ≈ $7.7 million
- Four‑year loss: ≈ $31 million
This model ignores ancillary revenue (housing, fees) and assumes yield remains constant. In reality, yield often falls when rankings decline, compounding the financial hit.
Public university scenario
Public universities rely on out‑of‑state tuition to subsidize lower in‑state rates. The College Board reports that average 2024‑25 public four‑year tuition is $11,610 for in‑state students and $30,780 for out‑of‑state students. The roughly $19,000 price differential means that a modest drop in out‑of‑state enrollment can quickly erode revenue. For example:
- Assume a 5‑point ranking drop leads to a 5 % decline in out‑of‑state applications. At a university with 3,000 out‑of‑state undergraduates, that’s about 150 fewer students.
- Revenue impact: 150 students × $19,170 (difference between out‑of‑state and in‑state tuition) ≈ $2.9 million per year.
- Over four years, the loss exceeds $11 million - before accounting for auxiliary income and the possibility that yield may also decline.
Because out‑of‑state students are more sensitive to reputational cues, public universities have a strong incentive to protect or improve their rankings.
Leveraging AI Interview Practice Platforms to Protect Rankings
Rankings increasingly reward institutions that prepare students for the workforce. The QS Graduate Employability methodology devotes 65% of its weighting to employer reputation, alumni outcomes and partnerships. To perform well on these metrics, universities must ensure their graduates excel in interviews and secure desirable positions.
An AI‑powered interview practice platform can help universities strengthen employability outcomes and mitigate the effects of ranking declines. Key benefits include:
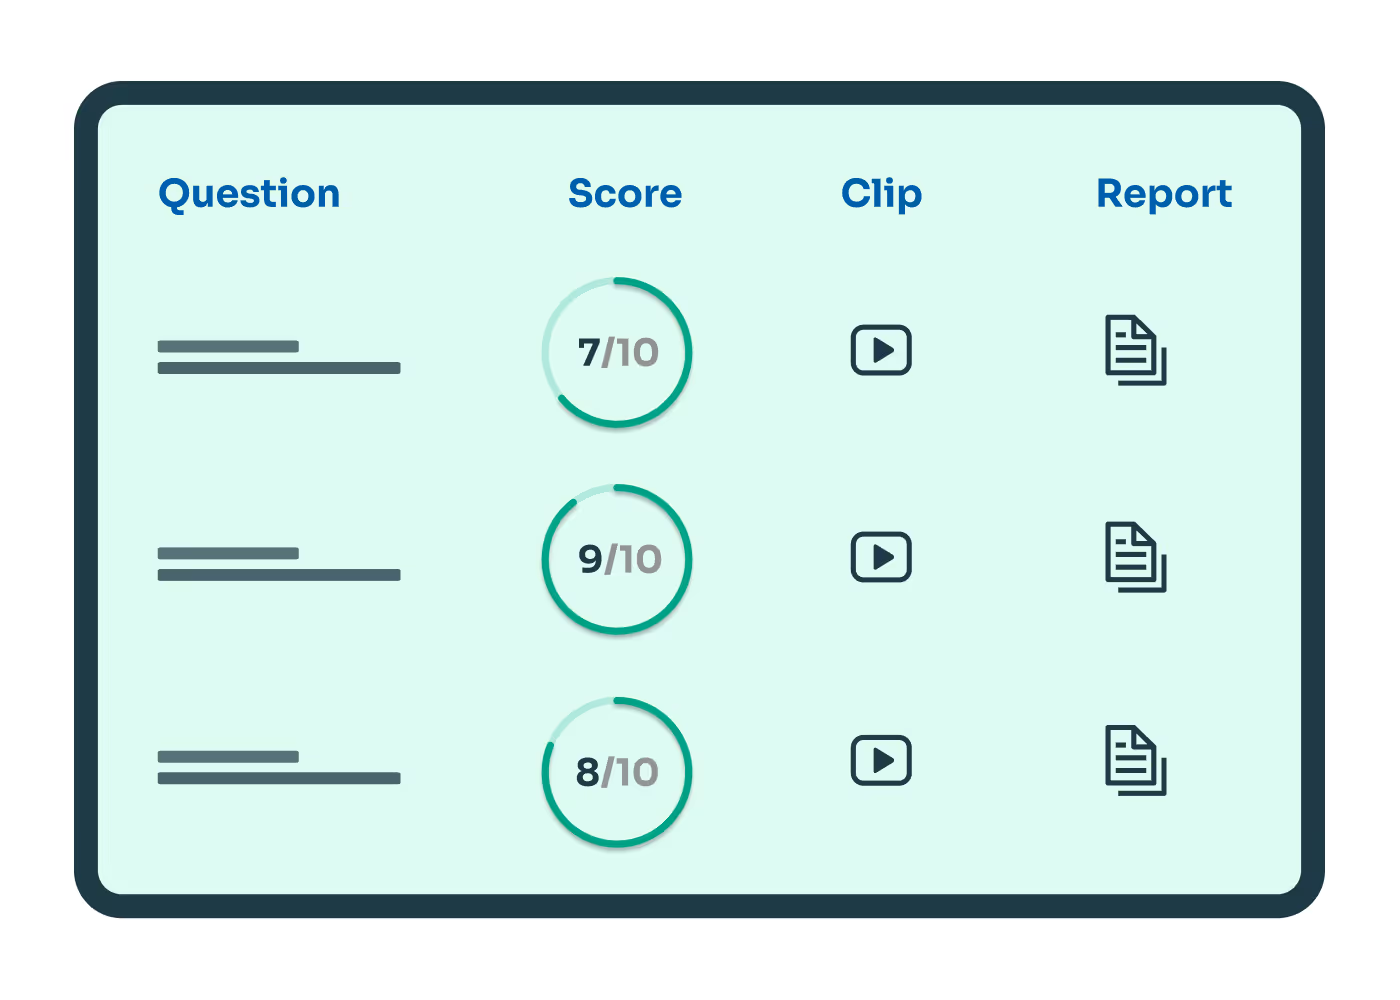
Scalable interview preparation - Students can practise with AI‑generated interview questions tailored to their major, industry and experience level. Automated feedback on content, clarity and communication helps candidates refine their performance.
Data‑driven insights - Aggregated performance data reveal common weaknesses in student interviewing skills, allowing career services to design targeted workshops and track improvements over time.
Employer alignment - Platforms can incorporate questions and evaluation criteria from hiring partners, aligning student preparation with actual employer expectations. Such collaboration strengthens employer‑student connections, a key QS indicator.
Showcasing outcomes - Institutions can report improved interview success rates to prospective students and ranking bodies, bolstering employer reputation and alumni outcomes metrics.
Universities not only improve their QS ranking but also create a compelling value proposition for applicants by enhancing graduate employability. Such tools can make the difference between a ranking slide and a virtuous cycle of improved outcomes and growing enrolments.
University rankings are not mere bragging rights
Research shows that they have a measurable impact on applicant behaviour, yield rates and institutional finances. A drop of just a few places can reduce applications, especially among lucrative out‑of‑state and international students.
Hence, strategic improvements in ranking - through investments in academic quality and career preparation - can drive dramatic growth in applications and selectivity.
As employability metrics become more prominent in ranking methodologies, universities must prioritise career outcomes. Adopting AI‑driven interview practice platforms is one actionable strategy to bolster employer reputation and alumni success.
Such tools can help institutions deliver on their promise to students, sustain high rankings and avoid the costly enrollment declines that accompany a fall in the tables.
You might also like


For decades, the Applicant Tracking System (ATS) has been the workhorse of talent acquisition. Designed to bring order to the chaos of high-volume applications, these platforms became the central database for nearly every recruiting team. They were built to manage, sort, and store candidate information. But the world of work has changed, and the very systems designed to streamline hiring are now becoming its biggest bottleneck.
Traditional ATS platforms were built for a linear, administrative process—one that treats candidates like data entries rather than people. Today, hiring is dynamic, conversational, and fiercely competitive. In this new landscape, Conversational AI is not just an add-on; it represents a fundamental rethinking of how companies find and engage talent. Legacy ATS tools are simply not equipped for this new era, and their shortcomings are becoming impossible to ignore.
The Cracks in the Foundation: Where Legacy ATS Fails
Traditional ATS platforms are failing because they were designed to solve yesterday's problems, not today's. Their limitations create friction for candidates, recruiters, and hiring managers alike.
1. The Candidate "Black Hole" and Poor Experience
The most common complaint about the traditional hiring process is the poor candidate experience, and the ATS is often the main culprit. Clunky, non-mobile-friendly interfaces, repetitive data entry, and a lack of meaningful communication leave applicants feeling frustrated and ignored. Candidates spend time carefully crafting resumes only to be met with automated, impersonal replies and silence. This negative experience can damage an employer's brand and drive top talent away before a human ever sees their application.
2. Keyword-Dependent Screening Misses Great Talent
At their core, most legacy ATS platforms are built on a simple, yet deeply flawed, principle: keyword matching. These systems scan resumes for specific terms and phrases, filtering out any that don't match the prescribed criteria. This rigid, rule-based approach often overlooks highly qualified candidates whose resumes don't contain the exact magic words. It penalizes creativity and fails to assess potential, focusing on elimination rather than discovery.
3. Limited Capabilities Beyond Simple Tracking
As the name implies, an Applicant Tracking System is primarily designed to track applicants. It functions as a digital filing cabinet. However, modern recruiting requires strategic tools, not just organizational ones. Legacy ATS platforms typically lack the advanced analytics, predictive insights, and proactive sourcing capabilities needed for strategic hiring. They operate in isolation, leading to data silos that prevent a holistic view of the talent pipeline.
4. Fragmented Collaboration and Inefficient Workflows
Hiring is a team sport, but traditional ATS software often hinders collaboration between recruiters and hiring managers. Feedback is scattered across emails and spreadsheets, evaluations are inconsistent, and the entire process becomes slow and disjointed. This lack of integration and flexibility forces teams into rigid, inefficient workflows instead of supporting the dynamic collaboration needed to make great hires.
The Conversational AI Revolution: From Tracking to Engaging
Conversational AI is changing the paradigm from passive tracking to active engagement. Instead of being a static database, modern hiring platforms use AI-driven agents to create dynamic, two-way conversations with candidates.
This approach brings several transformative benefits:
- 24/7 Engagement - AI assistants can interact with candidates around the clock, answering questions, providing updates, and scheduling interviews instantly.
- Personalized Experiences - Communication can be tailored to the individual candidate, making them feel seen and valued from the very first interaction.
- Deeper Insights - Conversational AI can conduct initial screening interviews, assessing skills and qualifications far more deeply than a simple resume scan ever could.
- Automation of Administrative Tasks - By automating scheduling, reminders, and follow-ups, Conversational AI frees up recruiters to focus on high-value activities like building relationships with top candidates.
Bridging the Gap with SpectraHire: The Future of Talent Intelligence
The limitations of traditional ATS are precisely what a true agentic AI platform like SpectraHire is built to solve. It moves beyond the outdated track-and-filter model to deliver an intelligent, conversational, and deeply insightful hiring experience.
Here’s how SpectraHire addresses the core failures of legacy systems:
- Goes Beyond Keywords with In-Depth Interviews: Instead of just scanning resumes based on keywords, SpectraHire's AI agents parse them contextually, conduct structured, unbiased video interviews. This allows every candidate to demonstrate their skills and potential, providing hiring teams with rich, qualitative data that a keyword search could never uncover.
- Creates a Modern and Engaging Candidate Experience: The process is designed with the candidate in mind. They can interview from anywhere, at any time, on any device. The experience is consistent, fair, and respectful, strengthening the employer brand with every interaction.
- Delivers Actionable Intelligence: Not Just Data. SpectraHire provides real-time analytics and data-driven insights on candidate performance, empowering recruiters and hiring managers to make faster, more informed, and less biased decisions.
- Fosters Seamless Collaboration: All interview data, analysis, and feedback are centralized within the platform, creating a single source of truth. This makes it easy for hiring teams to collaborate effectively and stay aligned throughout the process.
The age of the passive, administrative ATS is over. Winning the war for talent requires speed, intelligence, and a human touch—all things that Conversational AI is uniquely positioned to deliver. By leaving behind the limitations of the past, organizations can build a hiring process that is not only more efficient but also fundamentally fairer and more effective.
Ready to move beyond tracking and start engaging with top talent? Discover how SpectraHire can transform your hiring process with the power of Agentic AI.

If you’re a jobseeker, you might not always be greeted by a smiling recruiter on the other end of the screen. In some cases, you might end up speaking to an AI-powered interview agent instead of a human being.
Automated video interviews are becoming more common - and if you're job hunting, there's a good chance you'll face one as more and more companies of all sizes are staring to implement them as part of their hiring process.
But there’s no need to worry - this isn’t a dystopian shift. It’s simply a smarter, more efficient way to streamline early-stage hiring.
Let’s break it down.
So, what is an automated video interview?
An automated video interview is any interview process that doesn’t require a live human interviewer to be present in real time. Instead, candidates interact with a digital platform that guides them through the process.
There are a few different formats,
Pre-recorded video interviews - You record answers to a set of questions, usually within a time limit.
Text-based interviews - You type responses in a chat-style interface.
Voice-based interviews - You speak your answers, often over the phone or an app.
AI agent-led interviews - A conversational AI agent asks follow-up questions, reacts to your answers, and simulates a human-like interaction in real time.
Depending on the platform, your responses may be reviewed by recruiters, analyzed by AI, or both. Some platforms assess,
- The clarity and content of your answers
- Tone of voice and pace of speech
- Facial expressions and body language (in video formats)
- Use of role-specific keywords or soft skills
But ultimately, human recruiters still make the decisions. The AI is there to help, not to replace.
Why are companies using them?
Speed and fairness. That’s the short answer.
- Companies can screen hundreds (or thousands) of applicants without the back-and-forth scheduling.
- Each candidate goes through a structured process designed to ensure fairness - but the experience isn’t always identical. With AI agents, the interview can still follow a consistent evaluation framework while allowing the questions to adapt dynamically based on your responses. That means less bias, and more room for relevant, contextual conversation.
- Candidates can record answers at their convenience.
It’s not just for tech companies. Everyone from retail to banking to healthcare is jumping on board.
How can you prepare for an automated video interview?
There are mistakes you could make, but here’s the good news! You can absolutely practice using the real deal and get better. And platforms like SpectraSeek make it easier than ever.
Here’s your game plan!
1. Understand the format
Before your interview, find out (if you can):
- How many questions there will be
- How much time you’ll have to answer
- Whether you can re-record responses
Knowing the structure helps reduce surprise and anxiety.
2. Practice with AI video interview tools
Use video interview practice tools like SpectraSeek to simulate real interview scenarios. These tools allow you to:
- Practice job interview videos in your field
- Get instant AI feedback on your answers, pacing, and delivery
- Track progress over time with performance dashboards
SpectraSeek is especially helpful because it offers role-specific interviews and even analyzes non-verbal cues—a feature most traditional prep methods miss.
3. Prepare your answers (but don’t over-script)
You’ll likely face common interview questions like:
- “Tell us about yourself.”
- “Do you have experience using (a tool or software)?”
- “Do you have a notice period to serve, or will you be able to join immediately?”
Practice your answers out loud, but don’t memorize them word-for-word. Automated interviews can detect if you're too rehearsed.
4. Mind your environment
Yes, this matters, big time.
- Choose a quiet, well-lit space
- Position your camera at eye level
- Dress as if it’s a real in-person interview (because it kind of is)
Bonus - Practice your body language on camera. Your facial expressions, eye contact, and posture send signals, even if no one’s watching live.
5. Stay calm, stay you
There’s no need to stress if you mess up a sentence. Just pause, breathe, and keep going. Remember - your personality still shines through, even in a one-way setup.
Practice makes prepared
Automated video interviews might feel strange at first. Talking to a screen instead of a person can be awkward.
But like anything, preparation changes everything.
With the right AI video interview practice software, like SpectraSeek, you can build confidence, improve your delivery, and walk into (or sit for) every interview ready to shine!
As a UX researcher, you live for the "aha!" moment. That flash of insight when you finally understand why a user hesitated, sighed, or abandoned a task. You know the most valuable feedback isn't just about what users click—it's about how they feel.
But capturing that feeling is tough.
Traditional UX interviews are powerful, but they’re manual and slow. You can only talk to a handful of users. You spend hours transcribing, coding, and trying to connect the dots.
By the time you have a report, the sprint is already over.
And the subtlest clues—a moment's pause, a slight change in tone—are often lost in your notes or simply impossible to quantify across interviews.
What if you could bottle that "aha!" moment and get it at scale?
Scale, Nuance, and Context: Why Agentic AI-Powered Interviews Are Simply Better
Imagine deploying an AI agent trained for UX interviews to conduct one-on-one sessions with hundreds of users simultaneously.
With AI agents for UX, you get:
- Instant, Perfect Transcripts: Every conversation is transcribed and searchable the moment it ends.
- Structured Data: The AI agent can extract key themes, mentions, and sentiment, turning unstructured conversations into structured, analyzable data.
- The Nuance Layer: This is the real superpower. Our AI agents are built for emotional tone analysis. They capture the unspoken feedback hidden in human conversation—the hesitation before an answer, the frustration in a user's voice, or the excitement when they discover a feature they love.
The Emotional Edge: What Traditional Tools Can’t Hear
Most UX researchers have a good ear. You know when a user’s saying something nice but actually means, “This sucks.” But multiply that by hundreds of conversations, and your brain will start tuning out the subtleties.
That’s where a UX AI agent shines. It doesn’t just log user actions or scan transcripts—it listens like a therapist with perfect memory.
Pauses? Noted. Rising pitch when discussing pricing? Logged. A sudden drop in energy when a certain feature is mentioned? Flagged.
This isn’t just emotional tone analysis—it’s empathy at machine scale. It’s what lets teams go beyond the surface of what users say and uncover how they actually feel about their experience.
Building the Feedback Flywheel with AI
Imagine this: Every product feedback interview your AI agent conducts feeds a loop of continuous improvement. Not quarterly. Not monthly. Weekly, even daily.
When you use AI agents for UX, you're not just testing usability—you’re capturing sentiment in near real time. The result? A living, breathing insights engine that grows smarter over time.
For fast-moving product teams, this means:
- Releasing features that actually land
- Catching emotional friction before it becomes churn
- And testing hypotheses before they even hit your roadmap
Think of it as the difference between having a suggestion box... and having 100 candid, insightful coffee chats with your users every week.
How to Integrate AI Agents into Your UX Workflow
Bringing UX research AI into your process is straightforward. Here are a few best practices:
- Start with Open-Ended Questions: Don't lead the user. Design questions that encourage storytelling, and let the AI agent handle the follow-ups.
- Focus on "Why," Not "What": Use AI agents for exploratory research. Let them uncover the emotional drivers and pain points that you can later validate with quantitative testing.
- Combine Insights: Layer the emotional and tonal insights from your AI interviews on top of your existing analytics and usability data for a complete picture of the user experience.
- Test, Learn, Iterate: Start with a small batch of interviews. Use the insights to refine your questions and hypotheses, then scale up to gather more data.
What to Look for in a UX AI Agent
Not all AI tools are created equal. Some are glorified transcription engines. Others are souped-up survey bots. Here's what truly matters when evaluating a UX research AI tool:
- Conversational UX fluency: Can it hold natural, unscripted conversations without sounding robotic?
- Real-time emotion detection: Does it capture tone, pace, hesitation, and tell you why it matters?
- UX-native analytics: Are the outputs usable for product, design, and leadership? Or are you just handed a data dump?
Spectra checks these boxes because it was purpose-built for carrying out human-like conversations. That means more natural interviews, richer insights, and fewer “how did we miss this?” moments.
The Next Chapter in UX Research
At the heart of UX is a simple truth: people don’t always say what they mean.
They pause. They hedge. They say “it’s fine” when something isn’t. And when you’re running lean, chasing deadlines, and juggling a million priorities, it’s easy to miss the stuff that really matters.
That’s where AI can help—not by replacing the researcher’s eye, but by amplifying it.
With AI-led interviews, you don’t just get more data. You get a deeper understanding. You hear the hesitation, the excitement, the subtle emotional friction that tells you what no heatmap ever could.
And that means better products—not because a machine told you what to build, but because it helped you hear your users a little more clearly.
In the end, it’s still about empathy. You’re just bringing a little extra firepower to the job.
Subscribe to The InterspectAI Blog

